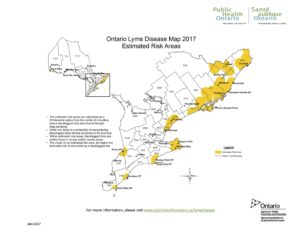
To continue the map-posting binge that I’ve been on lately, Public Health Ontario has just posted their updated Lyme Disease Risk Areas map for 2017. For comparison, you can still also access the 2016 map too, and you can see that the risk areas have indeed expanded somewhat, particularly in Eastern Ontario.
- The estimated risk areas are calculated as a 20 km radius from the centre of a location where blacklegged ticks were found through active drag sampling.
- While low, there is a probability of encountering blacklegged ticks almost anywhere in the province.
- Within estimated risk areas, blacklegged ticks are mainly found in woody and/or brushy areas.
For more information about how these maps are generated and how areas are selected for active tick dragging, download the complete pdf document here, or check out the PHO Lyme Disease website.